The most important best practice to get the most out of your connectors
Naming conventions can go a long way as you start activating multiple data sources on Looker Studio.
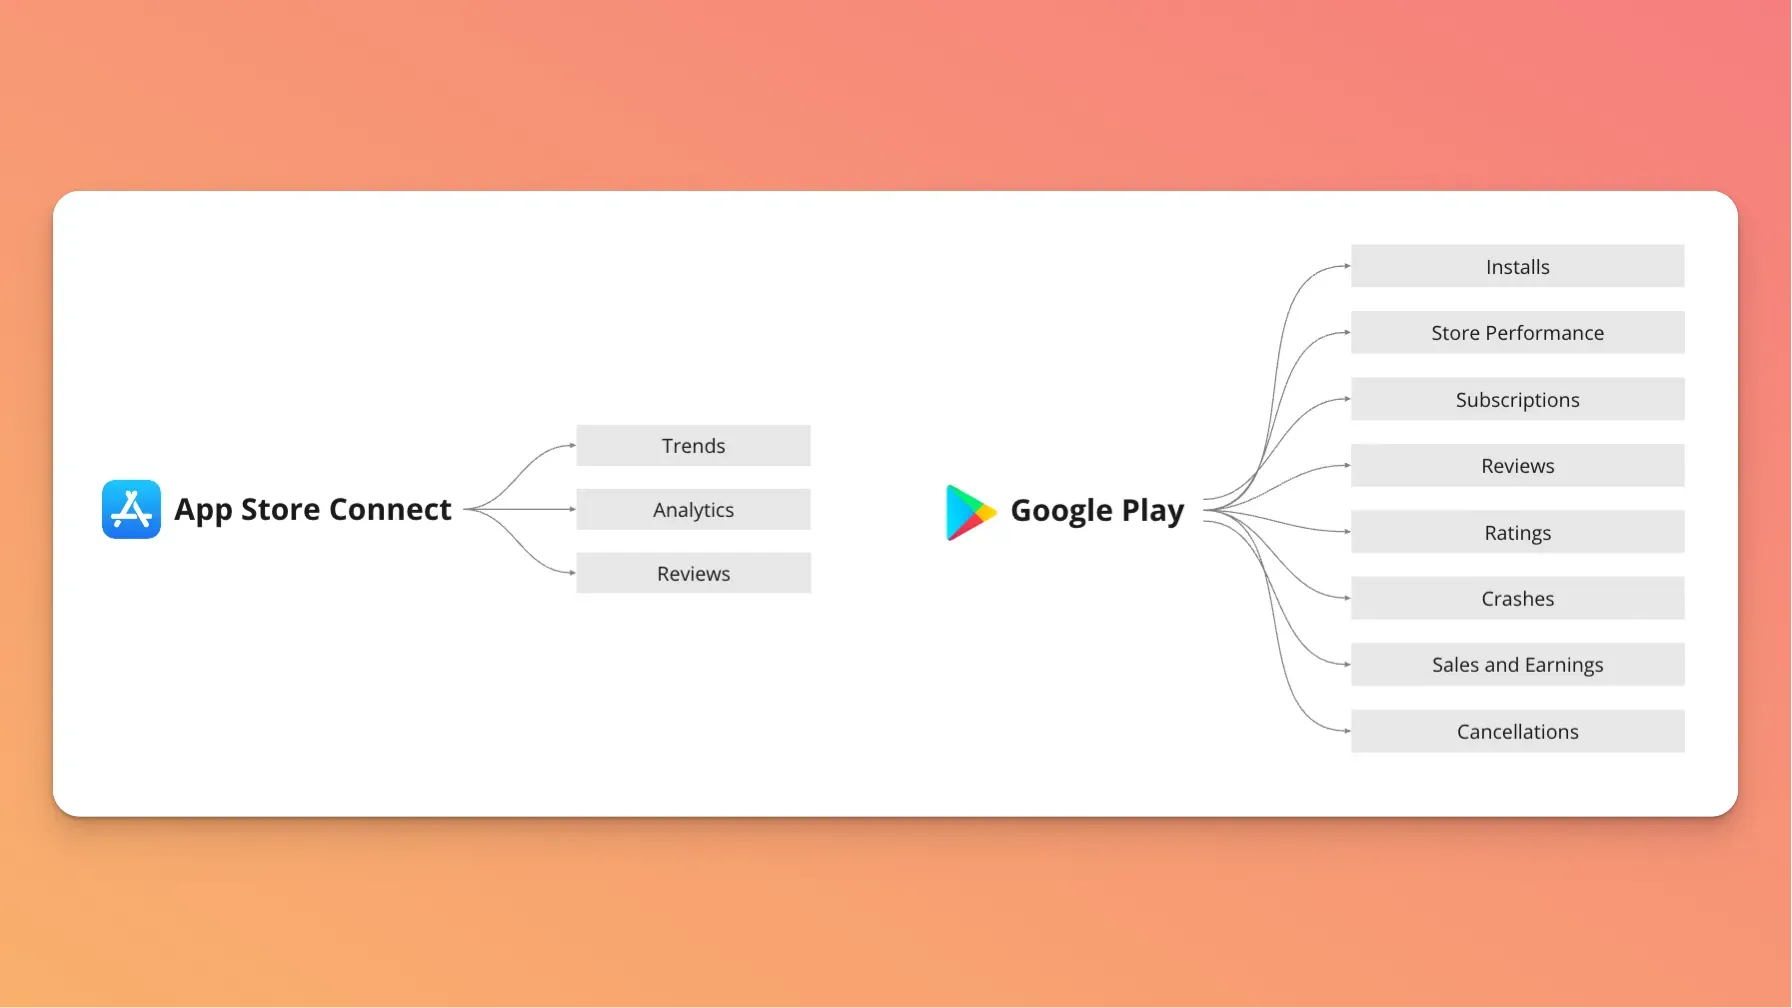
The truth is that there's a lot of data available for you on Easy App Reports. Here's a list of all the reports currently available (each report contains 7-30 fields):
Each report contains the different metrics you need to build your dashboards, and for those who are not used to building data visualizations, that might look scary. I get it. That was also my first impression when I connected to their APIs.
But, the thing is, there is one little trick that can make your break your success, and that is: naming your data sources correctly.
And no, I'm not overselling it.
Naming data sources enables you to:
- Activate templates, as each template requires different reports
- Unlock all metrics and dimensions within your connectors
- It makes it easy for you and your colleagues to find the metrics they need
So in the video below, I show you exactly how to do that: