Stop copy-pasting your App Store & Play Store data
Automatic sync for app teams who are done with manual reporting. Works with Looker Studio, BigQuery & AI Assistants.


Loved by 1,327 apps from 51 countries
Cut countless hours of repetitive work in 3 steps
1 / Connect your data
Link your Developer Accounts (as many as you need) and UA sources with a few clicks. No tech skills required.
2–10 minutes
2 / Choose a destination
Choose between our Looker Studio connectors or Google BigQuery to store and visualize your data.
2–10 minutes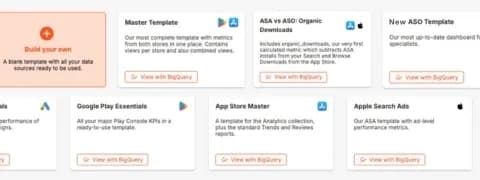
3 / Visualize your data
Get started with one of our Magic Templates or use our MCP integration to get your favourite AI assistant running.
3 minutesConnect once, explore forever
EAR uses only official, trustworthy APIs. No scraping, shady cookie tactics, or always-expiring auth/SMS tokens.
Explore integrationsAutomatic data sync
Your data will flow to your reports 100% on auto-pilot. No copy-pasting, CSV exports, or headaches.
See pricingLooker Studio Templates included
We call them “Magic Templates”. Why? Well, because all it takes is one click to get a copy and make it yours.
Template GalleryHow App Companies, Studios & Agencies use Easy App Reports
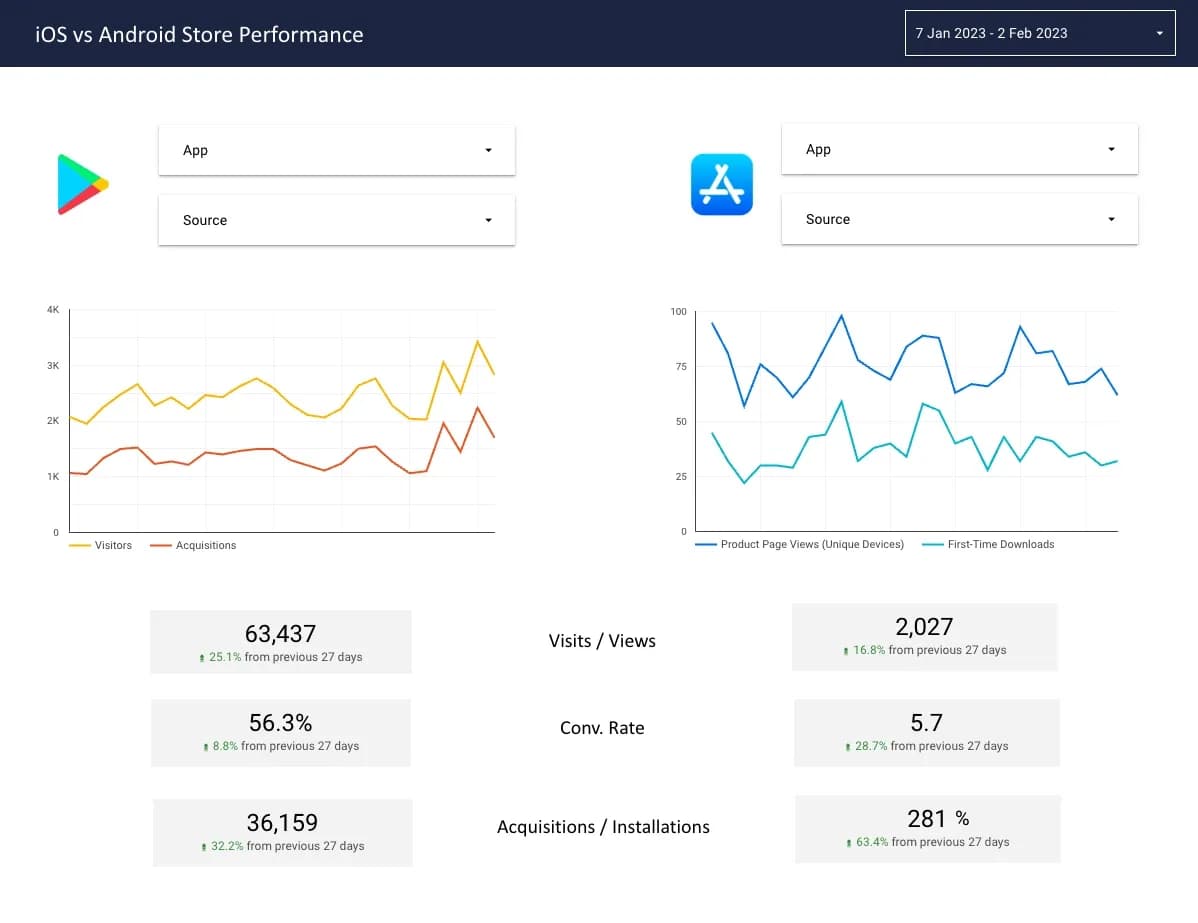
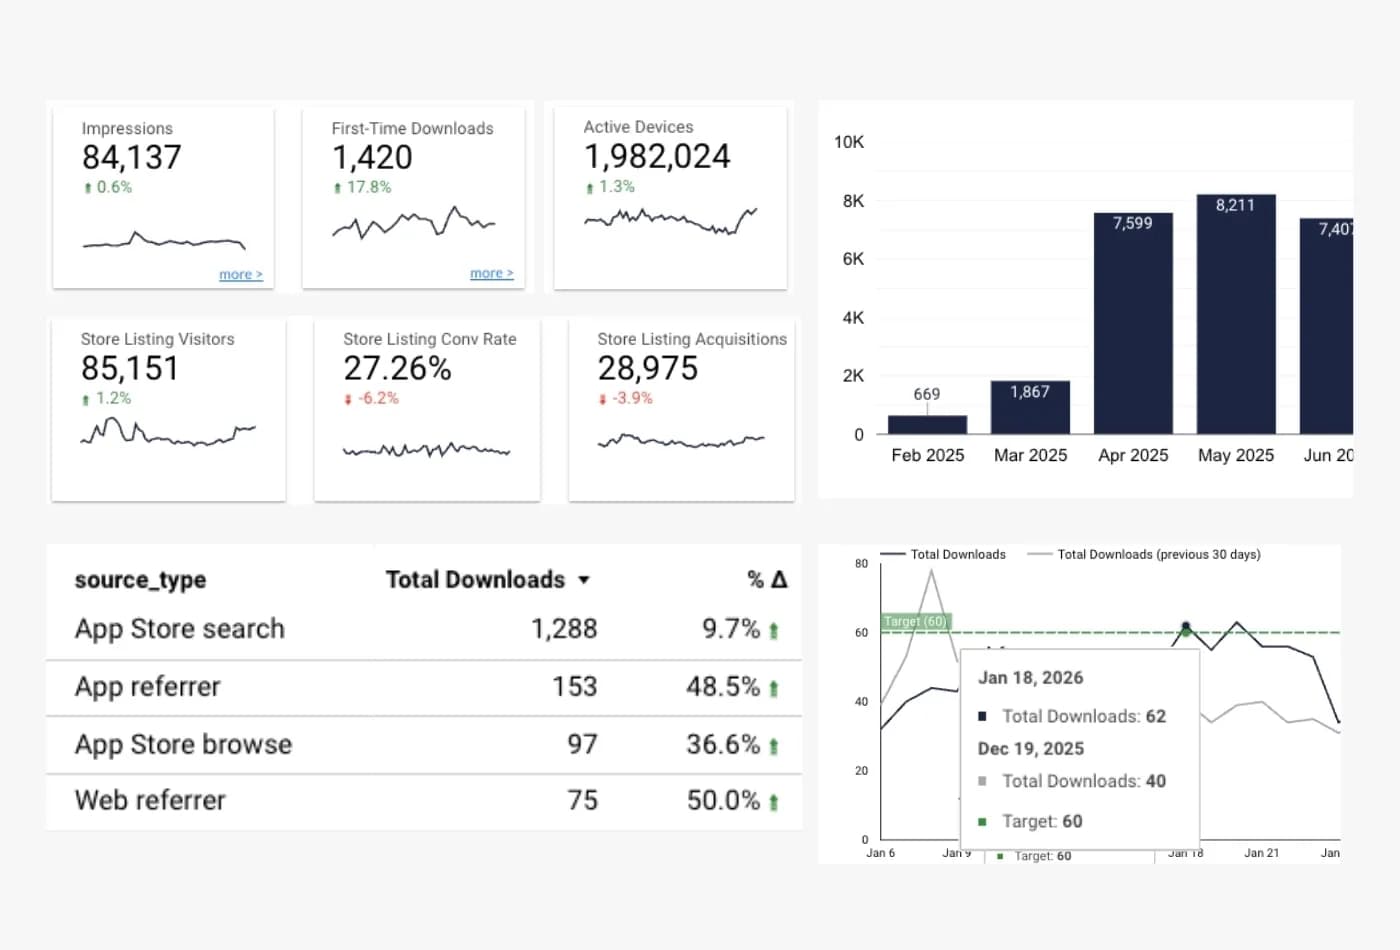
Your reporting on autopilot
With hundreds of data points to choose from, you'll finally have the dashboard you deserve. Some of the most popular KPIs our customers visualize include:
Impressions, Conv. Rates,
Downloads, Installs and Uninstalls
Ratings and Reviews
Subscription Sales and Revenue
UA Spend, Clicks, CPI, CPT, and so on
and much more.
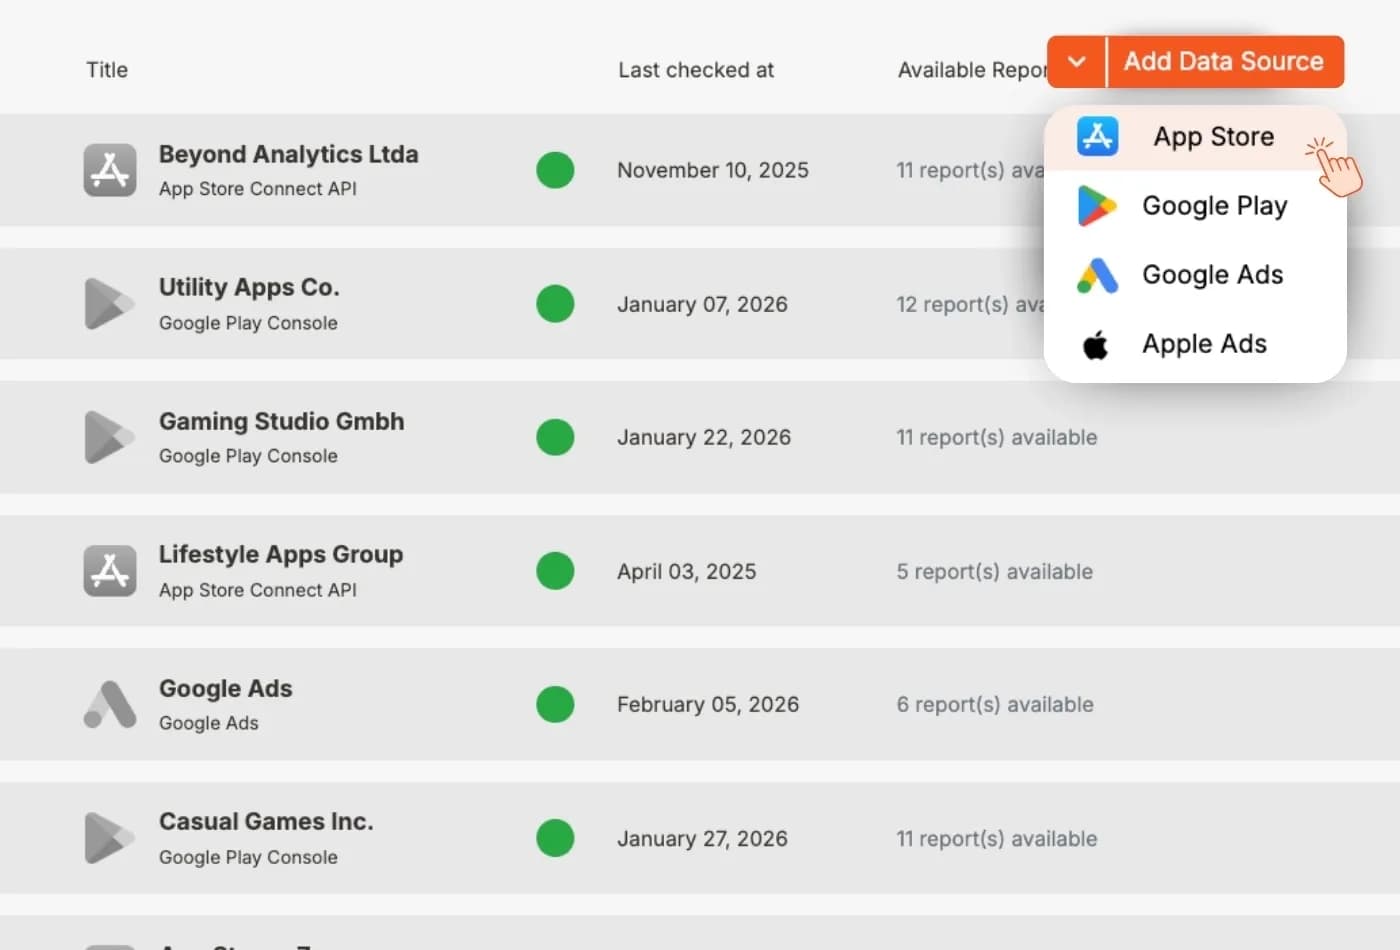
Bring multiple Apps & Developer Accounts into one place
If you're a VC, app portfolio, or an app agency, you'll finally be able to bring all your Developer Accountsinto one place.
And yes, you get to choose whether to display all your apps together, or isolate them into separate dashboards.
Use AI to get the most from your data
With Easy App Reports you can connect all your app's data with ChatGPT, Claude, Gemini, or any MCP-compatible AI.
From there you can ask questions, generate reports, dashboards, run analysis, and more. All without building any dashboards or complicated SQL.
Our MCP integration is available on all our base plans.
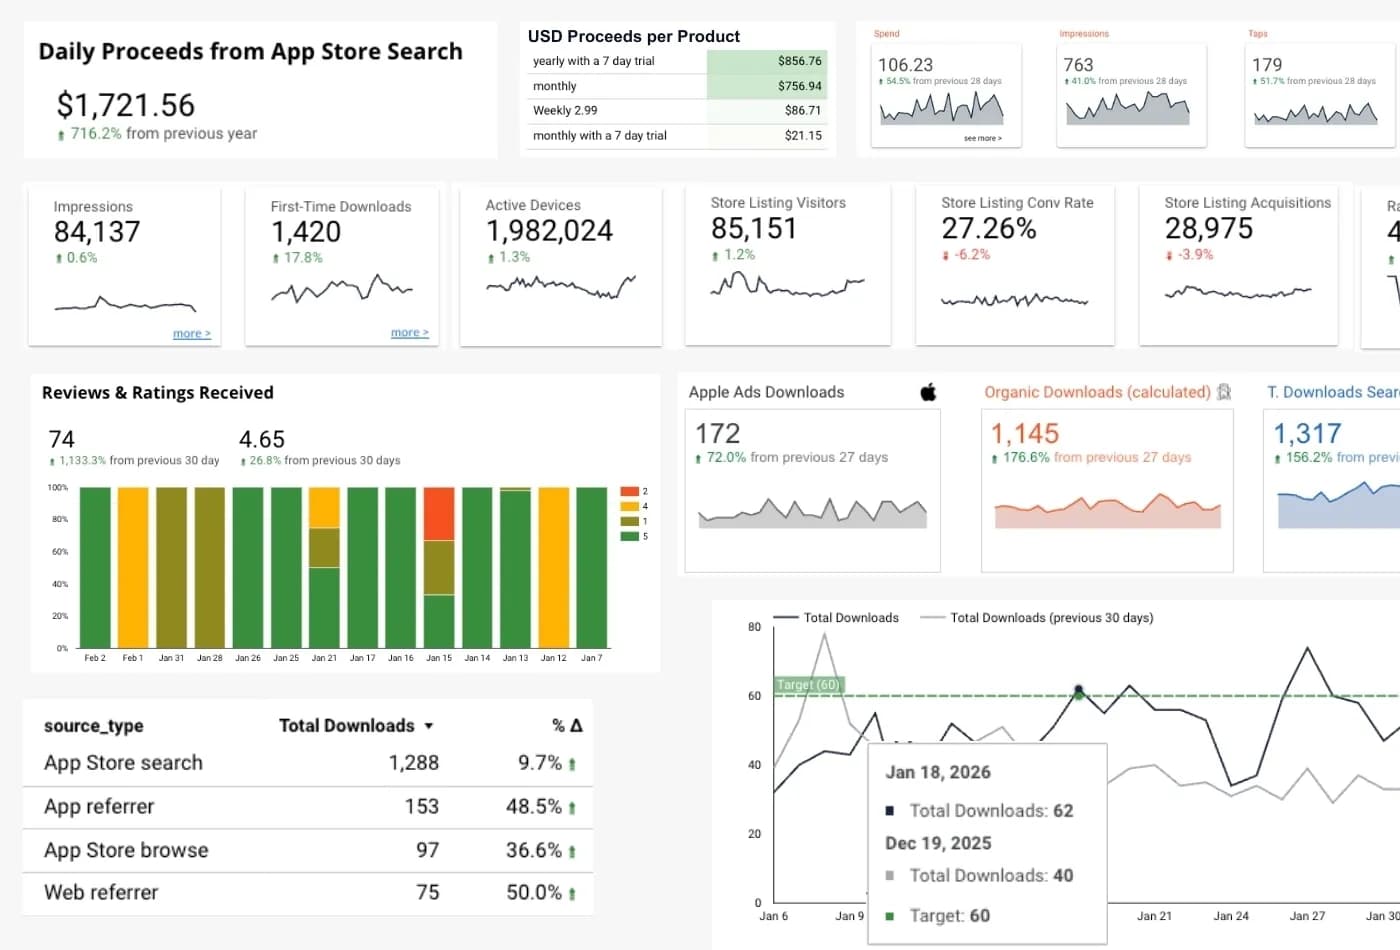
Acquisition metrics? We've got you.
Beyond having all the acquisition metrics from the stores, you'll get plenty of breakdowns for every need:
Traffic Source / Source Type
App Version and Device
Page Type and Title (App Store)
Search Term and UTM (Google Play)
Daily, Weekly and Monthly aggregation and more!
Do you also have [this metric]?
If it's on the API, the answer is yes
We get it: sometimes all you want is that specific metric you can't seem to find anywhere else. Sometimes that's revenue and subscriptions. Other times, an acquisition metric like Uninstalls or Product Page Views. If it matters to you, it matters to us.
Our commitment: if you miss any metric or dimension in our platform, you can ask and we do our best to get it for you.
GDPR & CCPA compliant
Compliant at its core — privacy is built in, not bolted on.
Encrypted in transit
Your data is always sent using HTTPS and SSL.
Hosted in the EU
Stored on an ISO 27001 certified server in Germany (EU).
Built to last, not to exit
Privately held and profitable since day one.
We never sell your data
We're in the business of providing insights, not selling data to 3rd parties.
Expert customer service
Gold-standard support from a team who genuinely gets Apps and Analytics.
The (only) data hub made for apps