Soft launch & Timeline: App Store Analytics
As for today you can start exploring the first of the five reports from the App Store Analytics API: Discovery & Engagement for Looker Studio.
This is the final step towards automating all your App Store data - and deprecate our Chrome Extension in a near future.
It contains: Impressions, Product Page Views, and Taps (that's new, right?).
Here comes the twist, though: you can filter it by Source, Page Type/Title, Country, Device, and more... All at the same time! Hello multi-dimensional filters!
How to unlock it
- Add an API Key with Admin permissions on your account
- For new API Keys, it takes 1-2 days for Apple to generate your reports
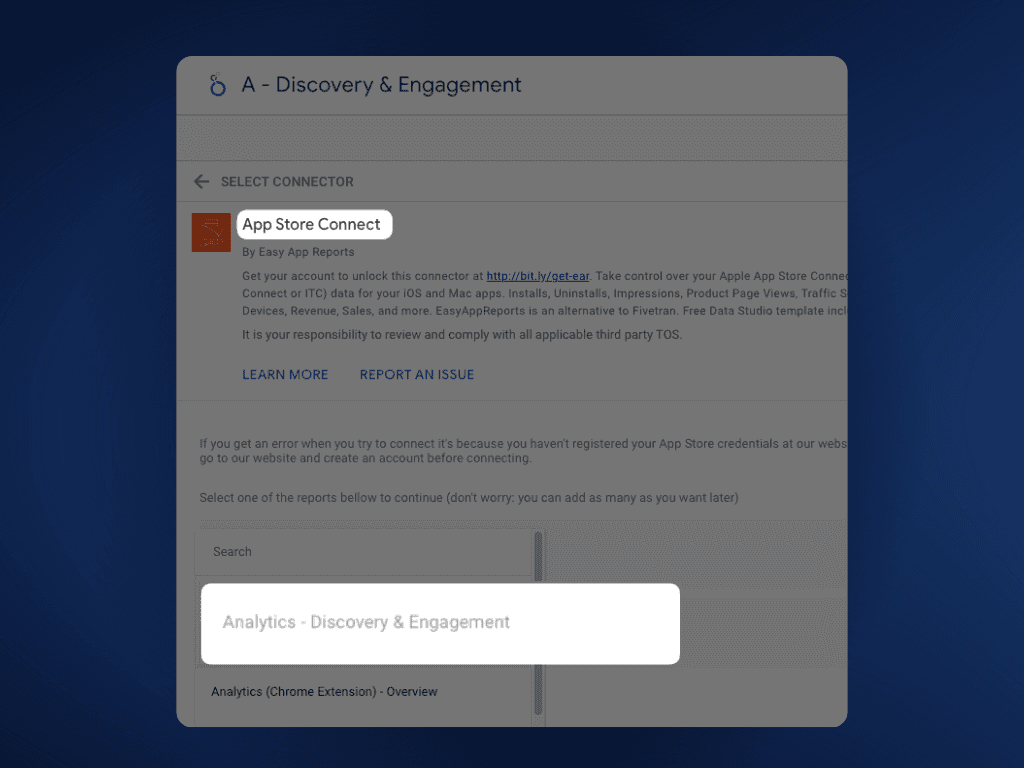
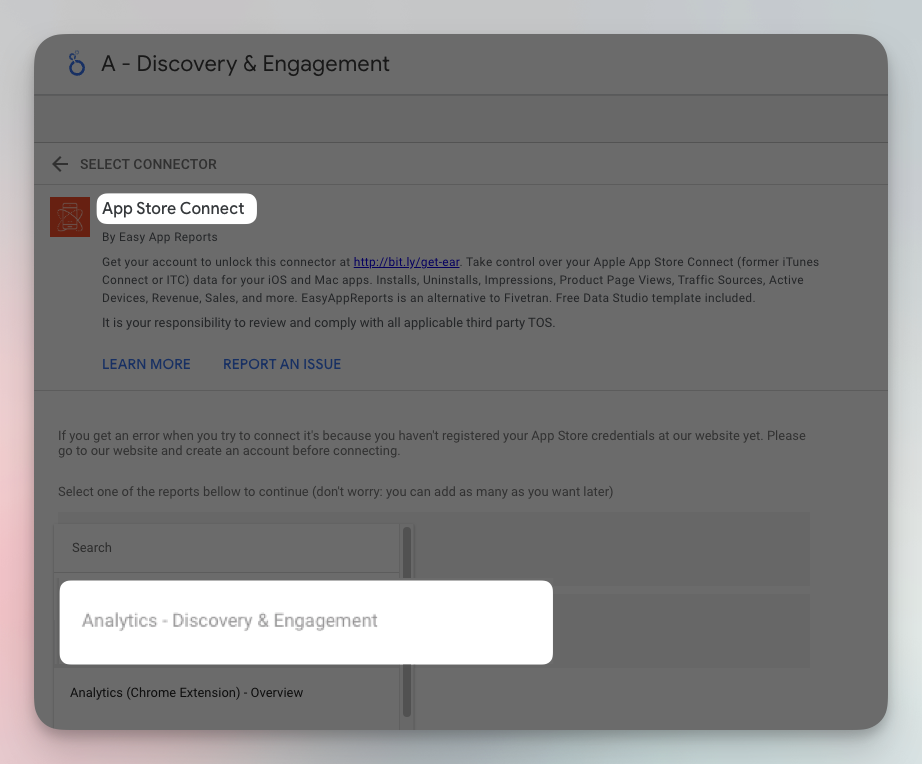
- Once you're good to go, open your Looker Studio conector and select "Analytics: Discovery & Engagement"
Analytics datasets are 2.2x heavier than Trends.
So just be patient when engaging with your data for the first time. It'll be downloaded, stored and cached, which does takes a while (1-2 min).
"Impressions are nice, but I need Total Downloads, Proceeds, etc. And what about BigQuery?"
Happy you asked because that's what's in the next couple of weeks:
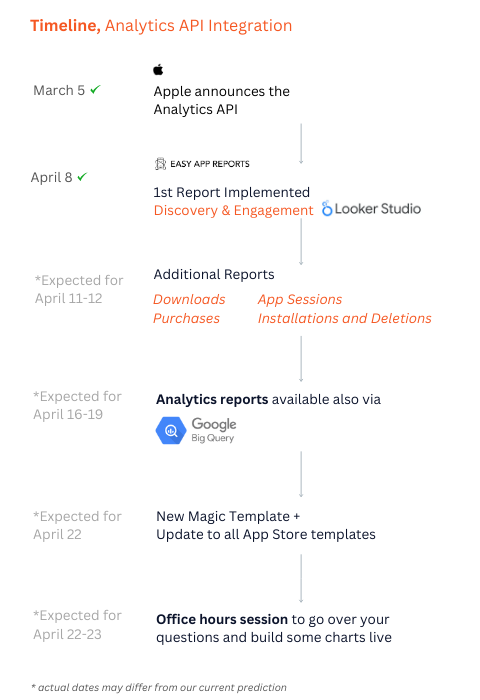
Timeline for the App Store Analytics API launch
So the plan is now to add other reports (when we say "reports" by the way, think of it as a collection of metrics) in the coming week. Then BigQuery. Then content: new Magic Templates, articles, and videos.
We'll be back once more reports are available!