Are bugs slowing us down?
Do you want to compare your Crashes and ANRs against your Acquisition, Sales and Engagement metrics? Then this dashboard is made for you.
This template is made to people who want to compare their Crashes and ANRs to:
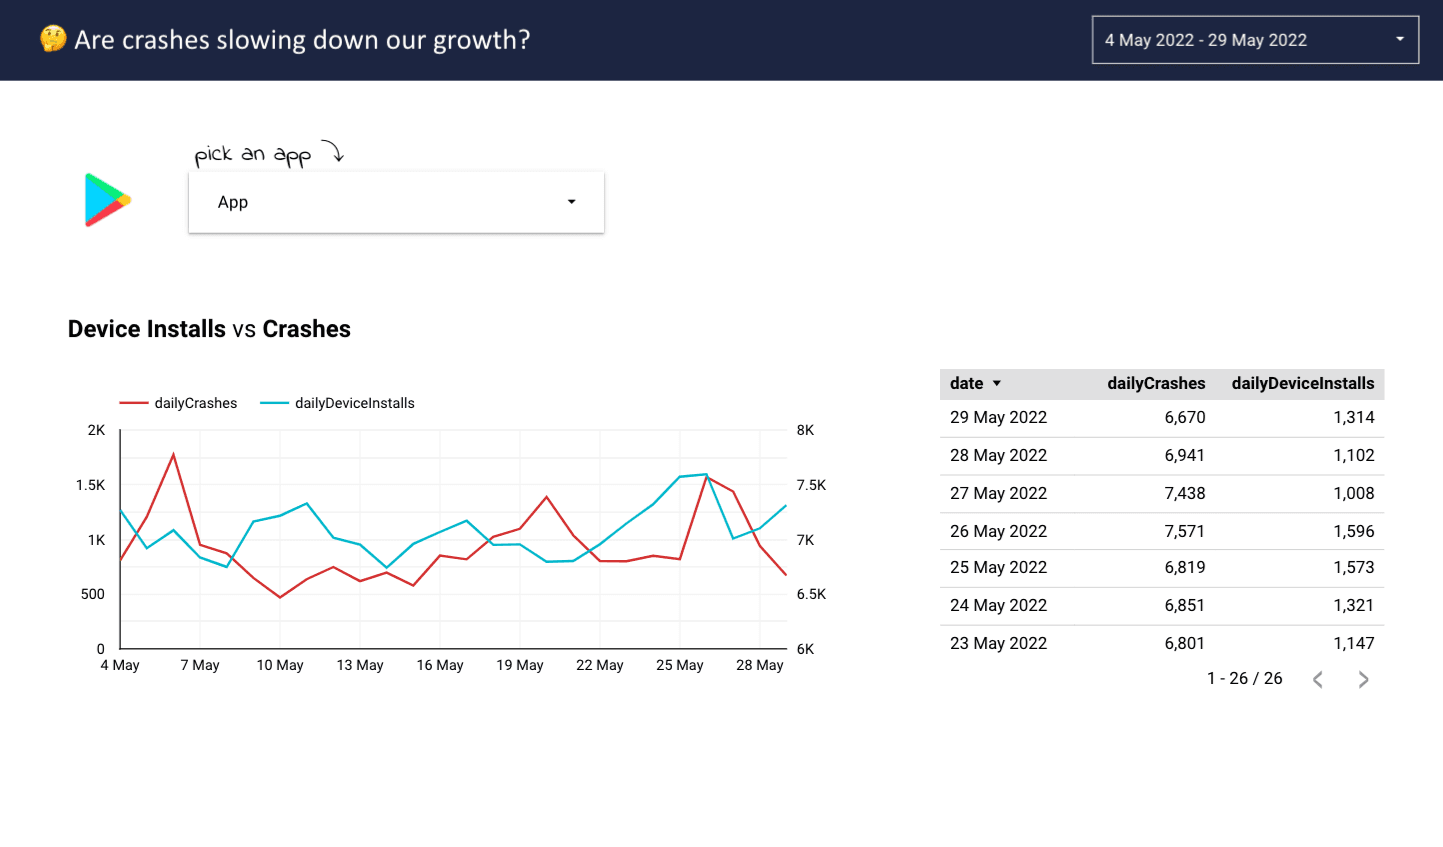
- Installs: am I getting fewer installs?
- Uninstalls: are people uninstalling my app due to bugs?
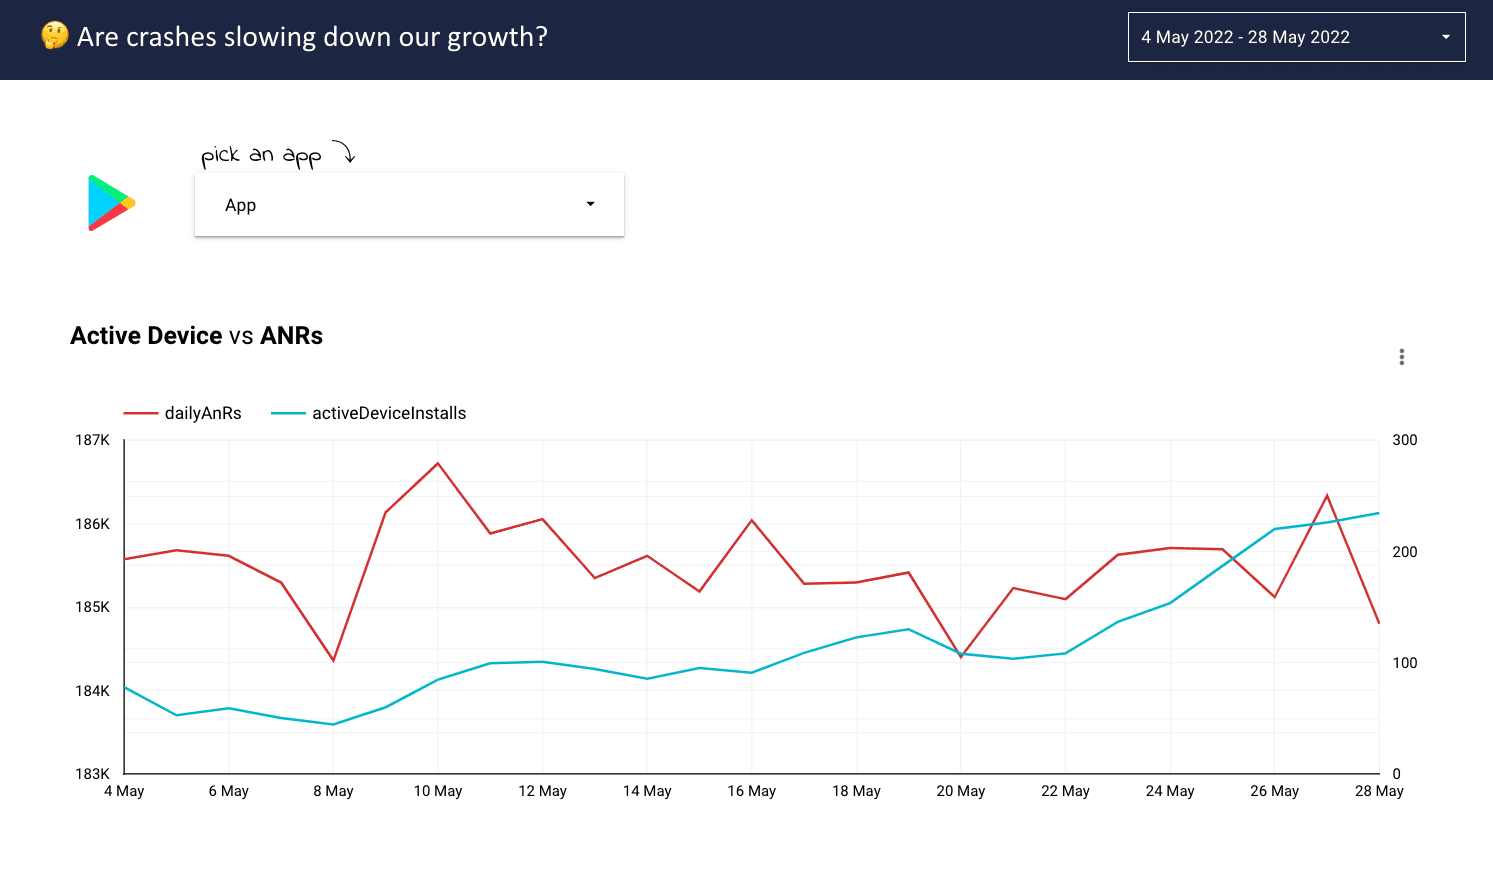
- Active Devices: are my users not coming back?
- Subscription Sales: are my sales being affected by bugs?
The overall idea isn't to imply causation, of course. It's meant to help you see both your bugs (crashes and ANRs) stats against your main acquisition, engagement and sales metrics. You can then identify suspicious patterns where it bugs might be affecting your app's growth.
Metrics
From Apple:
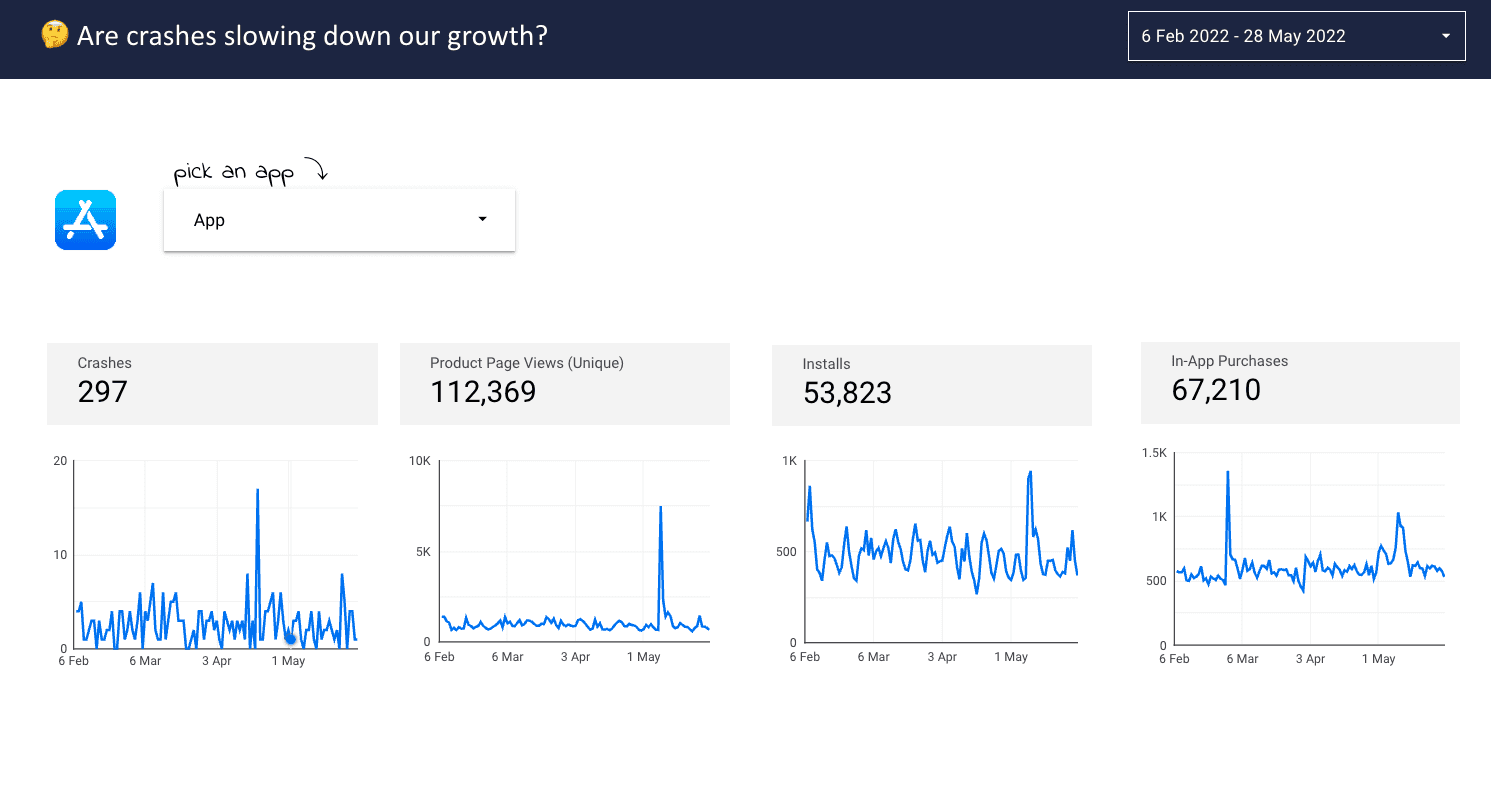
- Product Page Views
- Installations
- In-App Purchases
- Crashes
From Google:
- Installs
- Uninstalls
- Active Devices
- New Subscriptions
- Cancelled Subscriptions
Dimensions
From Apple:
- Date
- App Name
From Google:
- Data
- Package Name (App Name)
Preview
Required Connectors


Made For
Product ManagersBusiness AnalystsASO ProfessionalsCEOs and InvestorsMarketers
Authors

Rômulo Gomes
Founder CEO at Easy App Reports